
- 개발/실습 환경 소개
- Spark DataFrame 실습
- 요약
- +) : Spark vs. Pandas
개발/실습 환경 소개
Spark 개발 환경 옵션
- Local Standalone Spark + Spark Shell : 한대에서 돌아가는 local모드의 프로그램
- Python IDE – PyCharm, Visual Studio
- Databricks Cloud – 커뮤니티 에디션을 무료로 사용
- 다른 노트북 – 주피터 노트북, 구글 Colab, 아나콘다 등등 (colab의 사양이 나쁘지않고, 브라우저를 통해 사용이 용이하다.)
Local Standalone Spark
- Spark Cluster Manager로 local[n : thread 갯수] 지정
- master를 local[n]으로 지정
- master는 클러스터 매니저를 지정하는데 사용
- 주로 개발이나 간단한 테스트 용도
- 하나의 JVM에서 모든 프로세스를 실행
- 하나의 Driver와 하나의 Executor가 실행됨
- 1+ 쓰레드가 Executor안에서 실행됨
- Executor안에 생성되는 쓰레드 수
- local:하나의 쓰레드만 생성
- local[*]: 컴퓨터 CPU 수만큼 쓰레드를 생성
구글 Colab에서 Spark 사용
- PySpark + Py4J를 설치
- 구글 Colab 가상서버 위에 로컬 모드 Spark을 실행
- 개발 목적으로는 충분하지만 큰 데이터의 처리는 불가
- Spark Web UI는 기본적으로는 접근 불가 : ngrok을 통해 억지로 열 수는 있음(별로 추천하지 않음)
- Py4J : 파이썬에서 JVM내에 있는 자바 객체를 사용가능하게 해줌
Mac에서 Local Standalone Spark 사용
- Mac Catalina 혹은 이후 버전 기준: Z쉘이 기본으로 사용됨 (그전에는 Bash 쉘)
- 자바관련설정
- JDK8/11이 필요: 터미널에서 java -version 명령으로 체크
- JAVA_HOME 환경변수를 Z쉘 시작 스크립트(~/.zshrc)에 등록
- echo export "JAVA_HOME=\$(/usr/libexec/java_home)" >> ~/.zshrc
Spark DataFrame 실습
colab 환경에서의 pyspark, py4j 패키지 설치
!pip install pyspark==3.3.1 py4j==0.10.9.5
- 실습 1 - 헤더가없는CSV파일처리하기
- 입력 데이터: 헤더 없는 CSV 파일
- 데이터에 스키마 지정하기
- SparkConf 사용해보기
- measure_type값이 TMIN인 레코드 대상으로 stationId별 최소 온도 찾기
from pyspark.sql import SparkSession
from pyspark import SparkConf

conf = SparkConf()
conf.set("spark.app.name", "PySpark DataFrame #1")
conf.set("spark.master", "local[*]") # colab 의 모든 스레드를 쓰겠다.

spark = SparkSession.builder\
        .config(conf=conf)\
        .getOrCreate()

#데이터에 스키마 지정하기

#1. .toDF를 사용해서 설정하는 방법
df = spark.read.format("csv")\
      .load("1800.csv")\
      .toDF("stationID", "date", "measure_type", "temperature", "_c4", "_c5", "_c6", "_c7")

#2. 간단작업 : inferSchema를 통해 타입을 Spark에게 추측하도록 설정해주는 작업
df = spark.read.format("csv") \
      .option("inferSchema", "true")\
      .load("1800.csv")\
      .toDF("stationID", "date", "measure_type", "temperature", "_c4", "_c5", "_c6", "_c7")

#3. 매뉴얼로 스키마를 정의하는 작업
from pyspark.sql.types import StringType, IntegerType, FloatType
from pyspark.sql.types import StructType, StructField

schema = StructType([\
                     StructField("stationID", StringType(), True), \
                     StructField("date", IntegerType(), True), \
                     StructField("measure_type", StringType(), True), \
                     StructField("temperature", FloatType(), True)])

df = spark.read.schema(schema).csv("1800.csv")
measure_type값이 TMIN인 레코드 대상으로 stationId별 최소 온도 찾기
#Filter out all but TMIN entries
#1번째방법 : filter 사용하기
minTemps = df.filter(df.measure_type == "TMIN")

#2번째방법 : where 메소드를 사용하기 (filter과 동일한 형태로 사용하기)
minTemps = df.where(df.measure_type == "TMIN")

#3번째 방법 : where 메소드를 사용하기 (SQL Expression 으로 필터링 적용)
minTemps = df.where("measure_type = 'TMIN'")

# Aggregate to find minimum for every station
minTempsBystation = minTemps.groupBy("stationID").min("temperature")
minTempsBystation.show()

# 리스트
results = minTempsBystation.collect()

for result in results:
print(result[0] + "\t{:.2f}F".format(result[1]))SparkSQL로 처리해보기
df.createOrReplaceTempView("station1800")

results = spark.sql(""" SELECT stationID, MIN(temperature)
FROM station1800
WHERE measure_type = 'TMIN'
GROUP BY 1""").collect()

for r in results:
    print(r)

- 실습 2 - 헤더 없는 CSV 파일처리하기
- 입력 데이터: 헤더 없는 CSV 파일
- 데이터에 스키마 지정하기: cust_id, item_id, amount_spent를 데이터 컬럼으로 추가하기 (모두 숫자)
- cust_id를 기준으로 amount_spent의 합을 계산하기
from pyspark.sql import SparkSession

spark = SparkSession.builder\
        .master("local[*]")\
        .appName('PySpark DataFrame #2')\
        .getOrCreate()
from pyspark.sql import SparkSession
from pyspark.sql import functions as func
from pyspark.sql.types import StructType, StructField, StringType, FloatType
schema = StructType([\
StructField("cust_id", StringType(), True), \
StructField("item_id", StringType(), True), \
StructField("amount_spent", FloatType(), True)])
df = spark.read.schema(schema).csv("customer-orders.csv")
df_ca = df.groupBy("cust_id").sum("amount_spent")
# .withColumnRenamed로 컬럼에대해 alias를 해줄 수 있다.
df_ca = df.groupBy("cust_id").sum("amount_spent").withColumnRenamed("sum(amount_spent)", "sum")
sum 이외의 다른 집계함수까지도 지원한다.
import pyspark.sql.functions as f

df_ca = df.groupBy("cust_id") \
        .agg(f.sum('amount_spent').alias('sum'))


# SUM, MAX, AVG값 구하기
df.groupBy("cust_id").agg( f.sum('amount_spent').alias('sum'), f.max('amount_spent').alias('max'), f.avg('amount_spent').alias('avg')).collect()
SparkSQL로 처리해보기
df.createOrReplaceTempView("customer_orders")

spark.sql("""SELECT cust_id, SUM(amount_spent) sum, MAX(amount_spent) max, AVG(amount_spent) avg
FROM customer_orders GROUP BY 1""").head(5)

spark.catalog.listTables()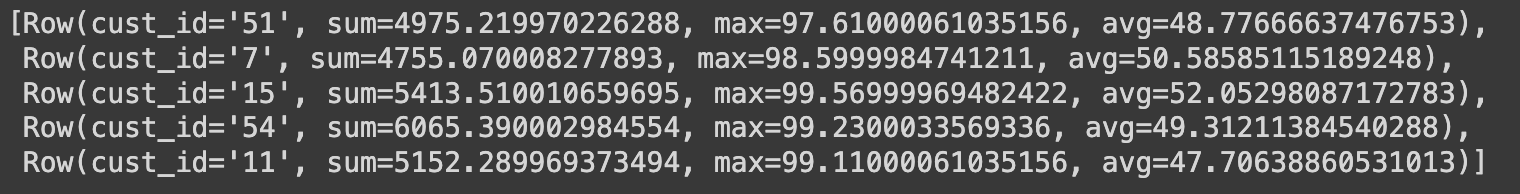
spark.catalog.listTables() : 카탈로그에 테이블이 저장된다.

Spark은 기본으로 in-memory 카탈로그를 사용. 스토리지 기반의 카탈로그를 쓰고 싶다면 SparkSession 설정할 때 enableHiveSupport()를 호출 (Hive metastore를 카탈로그로 사용하며 Hive UDF와 Hive 파일포맷 사용 가능)
- 실습 3. 텍스트를 파싱해서 구조화된 데이터로 변환하기 (Regex를 이용해서 아래와 같이 변환해보는 것이 목표)
입력: “On 2021-01-04 the cost per ton from 85001 to 85002 is $28.32 at ABC Hauling”
regex 패턴: “On (\S+) the cost per ton from (\d+) to (\d+) is (\S+) at (.*)”
(\S (non-whitespace character), \d (numeric character))

from pyspark.sql import SparkSession
from pyspark import SparkConf

conf = SparkConf()
conf.set("spark.app.name", "PySpark DataFrame #3")
conf.set("spark.master", "local[*]")
spark = SparkSession.builder\
        .config(conf=conf)\
        .getOrCreate()
import pyspark.sql.functions as F
from pyspark.sql.types import *

schema = StructType([ StructField("text", StringType(), True)])
transfer_cost_df = spark.read.schema(schema).text("transfer_cost.txt")

from pyspark.sql.functions import *
regex_str = r'On (\S+) the cost per ton from (\d+) to (\d+) is (\S+) at (.*)'
df_with_new_columns = transfer_cost_df\
                      .withColumn('week', regexp_extract('text', regex_str, 1))\
                      .withColumn('departure_zipcode', regexp_extract(column('text'), regex_str, 2))\
                      .withColumn('arrival_zipcode', regexp_extract(transfer_cost_df.text, regex_str, 3))\
                      .withColumn('cost', regexp_extract(col('text'), regex_str, 4))\
                      .withColumn('vendor', regexp_extract(col('text'), regex_str, 5))

final_df = df_with_new_columns.drop("text")
final_df.write.csv("extracted.csv")
final_df.write.format("json").save("extracted.json")
- 실습 4. Stackoverflow 서베이 기반 인기 언어 찾기
- stackoverflow CSV파일에서 다음 두 필드는 ;를 구분자로 프로그래밍 언어를 구분
- LanguageHaveWorkedWith
- LanguageWantToWorkWith
- 이를 별개 레코드로 분리하여 가장 많이 사용되는 언어 top 50와 가장 많이 쓰고 싶은 언어 top 50를 계산해보기
- stackoverflow CSV파일에서 다음 두 필드는 ;를 구분자로 프로그래밍 언어를 구분
from pyspark.sql import SparkSession
from pyspark.sql import functions as func
from pyspark.sql.functions import col, explode

S3_DATA_INPUT_PATH = 's3://spark-tutorial-dataset/survey_results_public.csv'
S3_DATA_OUTPUT_PATH = 's3://spark-tutorial-dataset/data-output'

spark = SparkSession.builder.appName('TopLanguage').getOrCreate()

df = spark.read.csv(S3_DATA_INPUT_PATH, header=True)['ResponseId', 'LanguageHaveWorkedWith', 'LanguageWantToWorkWith']

df2 = df.withColumn("language_have", func.split(func.trim(func.col("LanguageHaveWorkedWith")), ";"))\
        .withColumn("language_want", func.split(func.trim(func.col("LanguageWantToWorkWith")), ";"))

df_language_have = df2.select(df2.ResponseId,explode(df2.language_have).alias("language_have")).groupby("language_have").count()
df_language_want = df2.select(df2.ResponseId,explode(df2.language_want).alias("language_want")).groupby("language_want").count()

df_language50_have = df_language_have.sort("count", ascending=False).limit(50)
df_language50_want = df_language_want.sort("count", ascending=False).limit(50)

df_language50_have.write.mode('overwrite').csv(S3_DATA_OUTPUT_PATH+"/language50_have")
df_language50_want.write.mode('overwrite').csv(S3_DATA_OUTPUT_PATH+"/language50_want")

print('Selected data is successfully saved to S3: {}'.format(S3_DATA_OUTPUT_PATH))
실습 5. Redshift 연결해보기MAU (Monthly Active User) 계산해보기두 개의 테이블을 Redshift에서 Spark으로 로드: JDBC 연결 실습
DataFrame과 SparkSQL을 사용해서 조인DataFrame JOINleft_DF.join(right_DF, join condition, join type): join type: “inner”, “left”, “right”, “outer”, “semi”, “anti”
요약...
- 데이터 처리에서 중요한 개념: Partition, Shuffling
- 데이터 구조: RDD, DataFrame, Dataset
- Spark Session 생성과 설정
- DataFrame 프로그래밍
+) 추가 : Spark vs. Pandas
Pandas : 파이썬으로 데이터 분석을 하는데 가장 기본이 되는 모듈 중의 하나
- 엑셀에서 하는 일을 파이썬에서 가능하게 해주는 모듈이라고 생각하면 됨
- matplotlib(시각화)나 scikit-learn(머신러닝)과 같은 다른 파이썬 모듈과 같이 사용됨
- 한대의 서버에서 다룰수 있는 데이터로 크기가 제약이 됨
- 큰 데이터의 경우 Spark을 사용, 작은 데이터를 다루는데 굳이 Spark을 쓸 필요가 없음!
- 병렬 처리를 지원하지 않음: 소규모의 구조화된 데이터 (테이블 형태의 데이터)를 다루는데 최적
Pandas로 할 수 있는 일의 예
- 구조화된 데이터를 읽어오고 저장하기
- CSV, JSON 등등 다양한 포맷 지원
- 웹과 관계형 데이터베이스에서 읽어오는 것도 가능
- 다양한 통계 뽑아보기
- 컬럼 별로 평균, 표준편차, percentile 등 계산하기
- 컬럼 A와 컬럼 B간의 상관 관계 계산하기 (correlation)
- 데이터 청소 작업 -> 데이터 전처리
- 컬럼별로값이존재하지않는경우디폴트값지정하기
- 컬럼별로 값의 범위를 조정하기 (normalization)
- Visualization
- Matplotlib와 연동하여 다양한 형태의 시각화 지원 (히스토그램, 바, 라인 등등)
Pandas의 데이터 구조
- 엑셀의 시트에 해당하는 것이 Dataframe
- 엑셀 시트의 컬럼에 해당하는 것이 Series
- 입력 dataframe을 원하는 최종 dataframe으로 계속 변환하는 것이 핵심
Pandas 데이터 변환
- numpy array로 변환 가능: to_numpy()
- numpy array에서 Pandas dataframe으로 변환도 가능. 이 경우 컬럼 헤더를 지정해주어야함
- Spark dataframe으로 변환 가능
- Spark dataframe에서 Pandas dataframe으로도 변환가능하지만 작은 데이터인 경우에만 의미가 있음 (보통 요약 통계정보나 일부 작은 데이터를 검증용으로 보는 경우)
- parallelize, collect
요한 개념: Partition, Shuffling ● 데이터 구조: RDD, DataFrame, Dataset
● Spark Session 생성과 설정
● DataFrame 프로그래밍
'Spark' 카테고리의 다른 글
| [Spark] Spark 내부동작과 클라우드 옵션(Part1. Spark 내부동작) (1) | 2024.02.13 |
|---|---|
| [Spark] Spark 프로그래밍: SQL (3) | 2024.02.13 |
| [Spark] Spark 프로그래밍: DataFrame (1) (1) | 2024.02.11 |
| [Spark] 빅데이터 처리와 Spark 소개(2) (1) | 2024.02.10 |
| [Spark] 빅데이터 처리와 Spark 소개(1) (1) | 2024.02.09 |


